


Bringing the IoT to Life
投稿人:DigiKey 欧洲编辑
2018-01-23
It is widely recognized that the Industrial Internet of Things (IIoT) promises to bring about a transformative effect across many traditional industries. Not only will it uncover processes that are inefficient, plants in need of maintenance, and help management improve asset utilization, but it also promises to make possible a raft of new business services. Deploying sensors such as those used to measure vibration, temperature and humidity across industrial processes will provide the base data for analytical applications to extract useful information and control plant operations. As many organizations embrace the IIoT, there is an increasing need for sensors and actuators to incorporate some form of display function. The reality of the IIoT is that everything is being automated and controlled from a cloud application, which is at odds with the needs of local operational and maintenance staff. A benefit for them would be visibility of plant metrics in order to help identify local issues and problems before they become critical. In many cases, this requirement can be achieved by having a single display that shows collected data from a number of sensor sources, ideally at a functional plant or asset level. This article will show how this requirement can be met with a low-cost, compact display module that incorporates wireless connectivity.
In the quest to obtain data from multiple points across a production line, the preferred route has been to affix low-cost, battery-powered, wireless connected sensors in key locations. The design criteria for such sensors have dictated a low resource microcontroller, a wireless module, and the sensor element. In many cases, the microcontroller and the wireless module have become one since the degree of application processing of sensor data is minimum compared to running the wireless protocol stacks. For the embedded developer, the design of such a sensor device is a relatively straightforward task. It is likely that most development time would be spent implementing power-saving sleep modes to balance the needs of keeping power consumption to a minimum, while reducing impact on application responsiveness.
However, the need to add a display function to the sensor increases the design complexity significantly. First, from a pragmatic perspective, adding a screen size that is of any practical use is likely to double the physical size. Second, there are power consumption considerations. A screen will also add to the memory and compute specifications of the host microcontroller, not to mention the need for an LCD controller. Before anything can be displayed, the developer needs to prepare fonts and images, and if a touchscreen is to be implemented, those controller functions as well.
For the embedded developer faced with implementing such a design, there are clearly a number of options. Increasingly, the time taken to create a custom discrete design is seen as a disadvantage. One alternative that is gaining adoption is to use a compact display module that not only integrates a host microcontroller with user application space, but that also offers wireless communication. An example is the recently launched gen4 internet of displays (IoD) series from 4D Systems (Figure 1). Based around an Espressif ESP8266 Wi-Fi microcontroller, the module offers a resistive touch 320 x 240 pixel TFT 65,000 true to life color display in sizes of 2.4, 2.8 or 3.2 inches.

Figure 1: gen4 internet of displays module.
The module has 512 kB of user Flash memory and 128 kB of SRAM, in addition to a microSD socket for installing extra memory for storing images and use in data logging applications. The overall dimensions of the gen4-IoD 2.8 inch model are 78.4 mm x 44.8 mm x 7.2 mm. The quickest method of programming is through the free downloadable Arduino IDE. This approach enables fast prototyping of design concepts with a minimum of development tools and resources. A gen4-IoD programmer adapter (Figure 2) is required to achieve direct communication to a USB host, allowing connection to any of the 4D Systems gen4-IoD series through a 10-pin FPC cable.

Figure 2: gen4-IoD programming adapter.
Using the Arduino IDE not only provides a low-cost and well-proven method of programming the gen4-IoD module, but also gives access to a host of code examples and resources from across the extensive ESP8266 community.
The gen4-IoD is extremely well supported from a hardware perspective, but developers will find the degree of software application resources particularly good. To facilitate the creation of graphics-based user interfaces, 4D Systems provides the GFX4d library. Including an extensive list of primitive graphic functions, the library and additional resources can be downloaded from the 4D Systems GitHub repositories. The company also provides a graphical development environment, called Workshop 4, which speeds the development of GUI applications through the use of widgets and layout-based automated coding.
To illustrate how to use a gen4-IoD display, let’s consider a requirement where we wish to receive and display data from a cloud platform. Further, let’s say the data is that of the temperature of a fluid flowing through a gate valve in an industrial process. The display would probably be mounted some distance from the valve itself, whereas the temperature sensor would be placed either in or on the valve. As discussed at the beginning of the article, the design specifications of the sensor can be very different from those of the display.
For our example, we could set up an application that just simulates receiving data. However, before we look at the design of the gen4-IoD display, let’s look at some of the easy ways you can create an IoT test bed using readily available resources. As our display will only receive data from the cloud, we need to find a way to push data up to the cloud from a sensor. There are many headless Wi-Fi single board computers that have such a capability, one example being the miniature Adafruit Feather M0 board. Equipped with a Microchip microcontroller and Wi-Fi module, the board is fully supported by the Arduino IDE, enabling rapid prototyping. Let’s now look at how this can be used to push data to an Internet of Things cloud platform.
One of the most popular protocols used in IoT applications is messaging queuing telemetry transport (MQTT). This extremely simple and lightweight protocol is usable on pretty much any form of network. Devices can ‘publish’ data to a server, and coming the other way, devices can ‘subscribe’ to a feed where data is pushed from a server. On the server, a small application called the MQTT broker handles the communications between subscribers and publishers. There are a number of commercially available cloud platforms you can choose from for your application, but for this simple example we’ll use Adafruit’s Adafruit.IO platform. Offering different usage plans according to message frequency, the free option is ideal for prototyping purposes. Adafruit provides a detailed guide to getting started using the Feather M0 board along with plenty of examples for use with a variety of other single-board computers. For our example we’re using a simple sketch that incorporates Adafruit’s MQTT library that sends a simulated temperature value generated as a random number between 15°C and 28°C (Figure 3) to Adafruit.IO.

Figure 3: Sketch used on Adafruit Feather M0 Wi-Fi to communicate to Adafruit.IO.
The Adafruit.IO dashboard in Figure 4 below was set up to receive the published data. We now have an MQTT data feed to which we can subscribe our gen4-IoD display module.

Figure 4: Adafruit.IO feed dashboard.
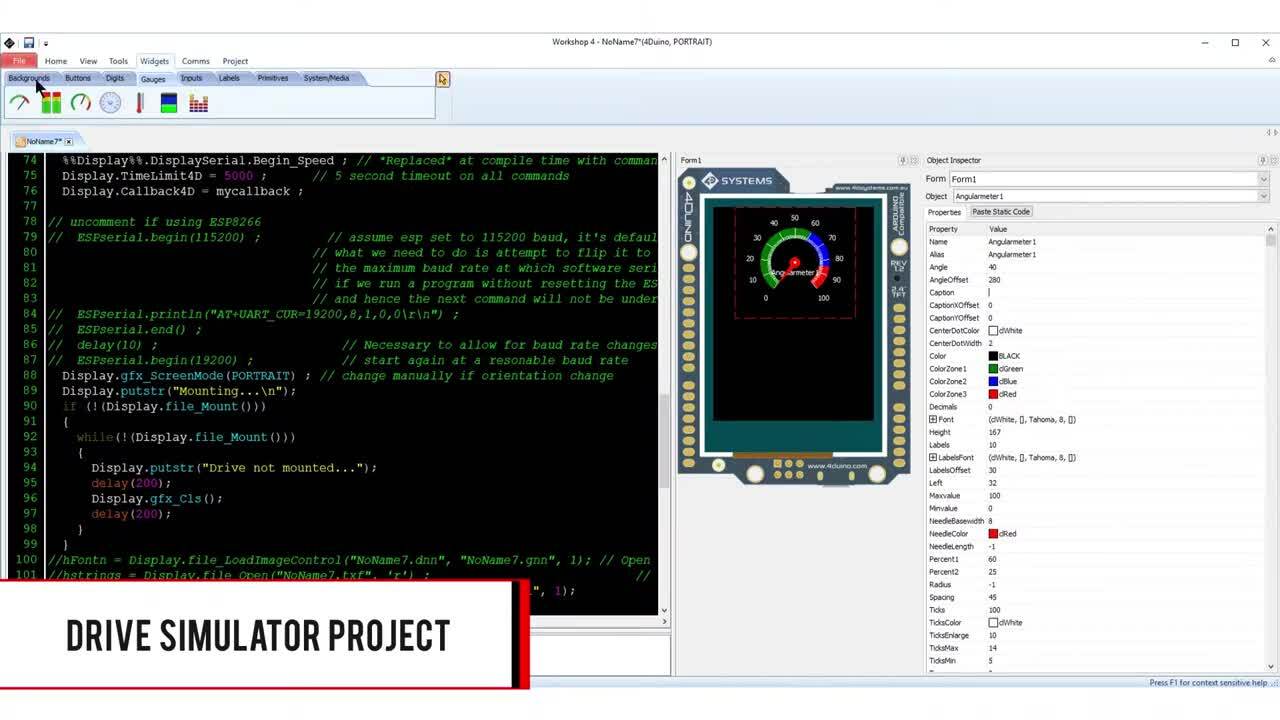
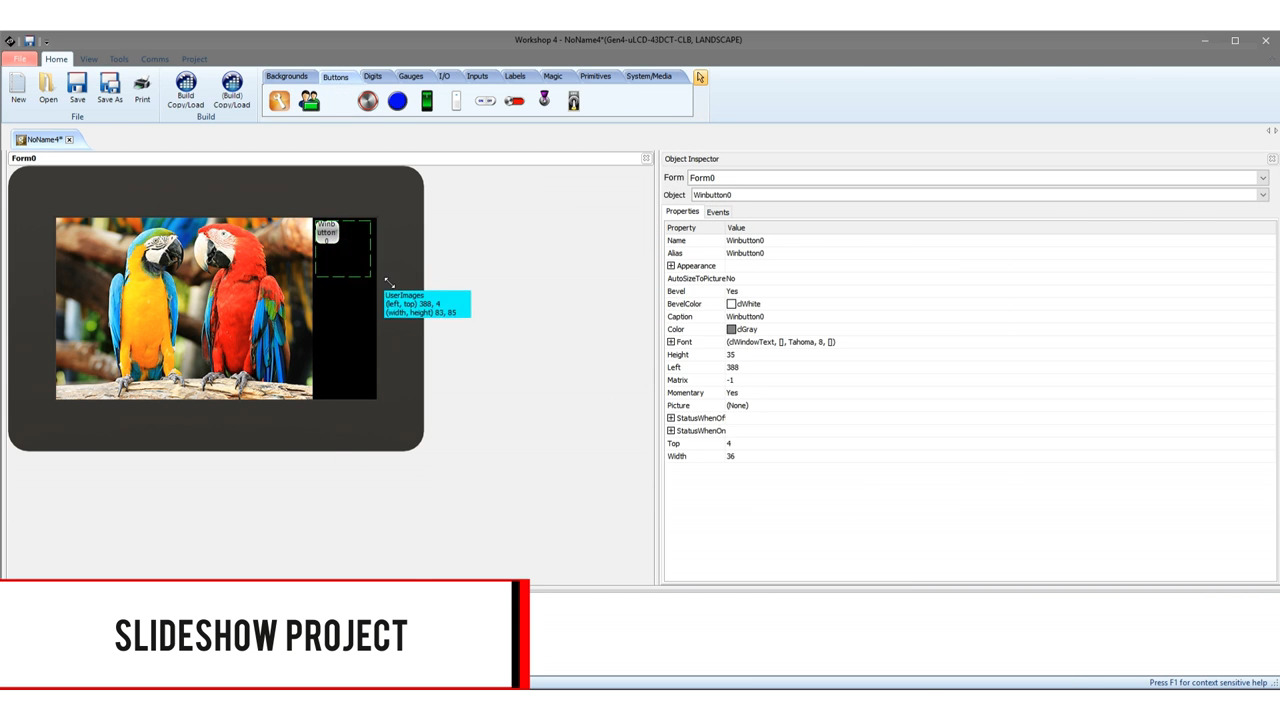
Our first task with the gen4-IoD module is to set up the GUI to display the temperature of the liquid passing through our imaginary valve. We use the Workshop 4 IDE to achieve this. Before commencing, ensure you have downloaded and installed the latest version of this from the 4D Systems site. Run the application and open up a new project, selecting the gen4-IoD display from the available settings. There are two main window frames, the Arduino sketch code it generates on the left, and a virtual display of the module on the right. (Figure 5).
In order to make the display as user-friendly as possible, a simple valve icon is added to a colored background.

Figure 5: 4D Systems Workshop 4 with virtual gen4-IoD display on right.
Workshop 4 has various modes of operation; the one illustrated above highlights that it can generate Arduino code as you design your GUI. A comprehensive range of widgets is available that provide predefined buttons, gauges and display elements that further speed a design. In this design we opt to use a seven-segment display widget by dragging it from the widget bar into the middle of the valve image. In Figure 5, in the lower right frame, you can see the seven segment properties that can be set to suit your application. Here we decided to present two digit numbers without any decimals. Static text, ‘Feed Valve 15’ is the only other information presented on the display.
Once you have arranged the image widgets, you can then select ‘Compile’ to generate the associated Arduino sketch, which is displayed on the left side of Figure 5. The process also creates the screen layout files that need to be stored on a microSD card prior to inserting it into the gen4-IoD module. This step also creates a constants definition file using the file name of the Workshop 4 project, in this case FeedValveConst.h, which needs to be included in your main sketch file. The screen layout files use a similar naming convention.
The next stage is to create the main sketch file for the gen4-IoD display. You can opt to use the Workshop 4 IDE to prepare the sketch rather than use the Arduino IDE. However, to do that you will still need to load the Arduino IDE on the same computer since Workshop 4 will make background calls to it when compiling and uploading the code. Figure 6 highlights the main include files which includes the ESP8266 Wi-Fi, the 4D Systems graphics library, along with two Adafruit MQTT files. Also included is the constants file created by the Workshop 4 IDE. You then need to enter the SSID and password parameters allowing the display module to connect to your Wi-Fi, followed by the Adafruit.IO user name and key used to create your feed.

Figure 6: Include files for setting up the gen4-IoD display.
In the sketch you also need to enter a number of commands in the setup section to initiate communication with the graphics library and display functions. These are shown in the top half of Figure 7. The image elements, iStatictext1, etc., are defined in the constants file and are subsequently addressed using the syntax gfx.UserImages (iStatictext1,0), etc. Value parameters, in this case the valve temperature, are passed as the second argument of this function.

Figure 7: Sketch code to set up gen4-IoD display function.
The completed sketch can be compiled within the Arduino IDE prior to uploading. If not already done, the gen4-IoD display module needs to be added to the list of available boards. Full details are provided within the module’s datasheet, but essentially it involves adding a board URL into the Arduino IDE preferences in order to provide an ESP8266 category from which you will find the gen4-IoD display listed. Note that several versions of the ‘ESP8266 by ESP8266 Community’ board manager file are available. The 2.3.0 file should be selected.
Once the sketch has been uploaded, the board should start running and the display should come to life. Using the serial monitor function is an extremely convenient method of debugging the application. When writing a sketch, you can always make liberal use of the Serial.print function to indicate where the program is, along with any key variables. In the top right corner of Figure 6, you can see the serial monitor window as the sketch starts to run. Initially connecting to the wireless access point, it obtains an IP address and then connects to the Adafruit.IO MQTT broker service. It then subscribes to the data feed and starts to receive each updated valve that is being passed to the feed from the Feather M0 board.
Figure 8 shows the gen4-IoD display working with the valve image and static text exactly as it looked when it was created within Workshop 4.

Figure 8: gen4-IoD display in use receiving data from Adafruit.IO.
Conclusion
In this article we have achieved a lot in a short period of time. We have seen how easy it is to start to push data up to a cloud IoT application and then to receive it back down to a module that not only integrates the compute and communication capabilities, but also a display. While the display layout in this example is extremely simple, it only took a matter of minutes to achieve. There was no need to worry about having to create fonts or any special images, libraries or drivers. In addition, with the display hosted by an extremely popular wireless microcontroller platform, developers can have confidence that there is support from an extended community of users. Access to free cloud resources, an MQTT broker service and all the necessary drivers and library files make for prototyping with ease.
免责声明:各个作者和/或论坛参与者在本网站发表的观点、看法和意见不代表 DigiKey 的观点、看法和意见,也不代表 DigiKey 官方政策。


 中国
中国